Stock Options Trading: How often should you reset your trading charts?

When it comes come to Trading one of the most important elements in being able to properly take trades is analyzing your chart. Your stock chart is filled with a series of information and events that cover long stretches of time.
If you are new to trading which I will assume you are, if you are looking up this question it’s important to know that the stock market and businesses move in cycles and because of this, information is constantly changing and so are the moves in the market reflected in the chart.
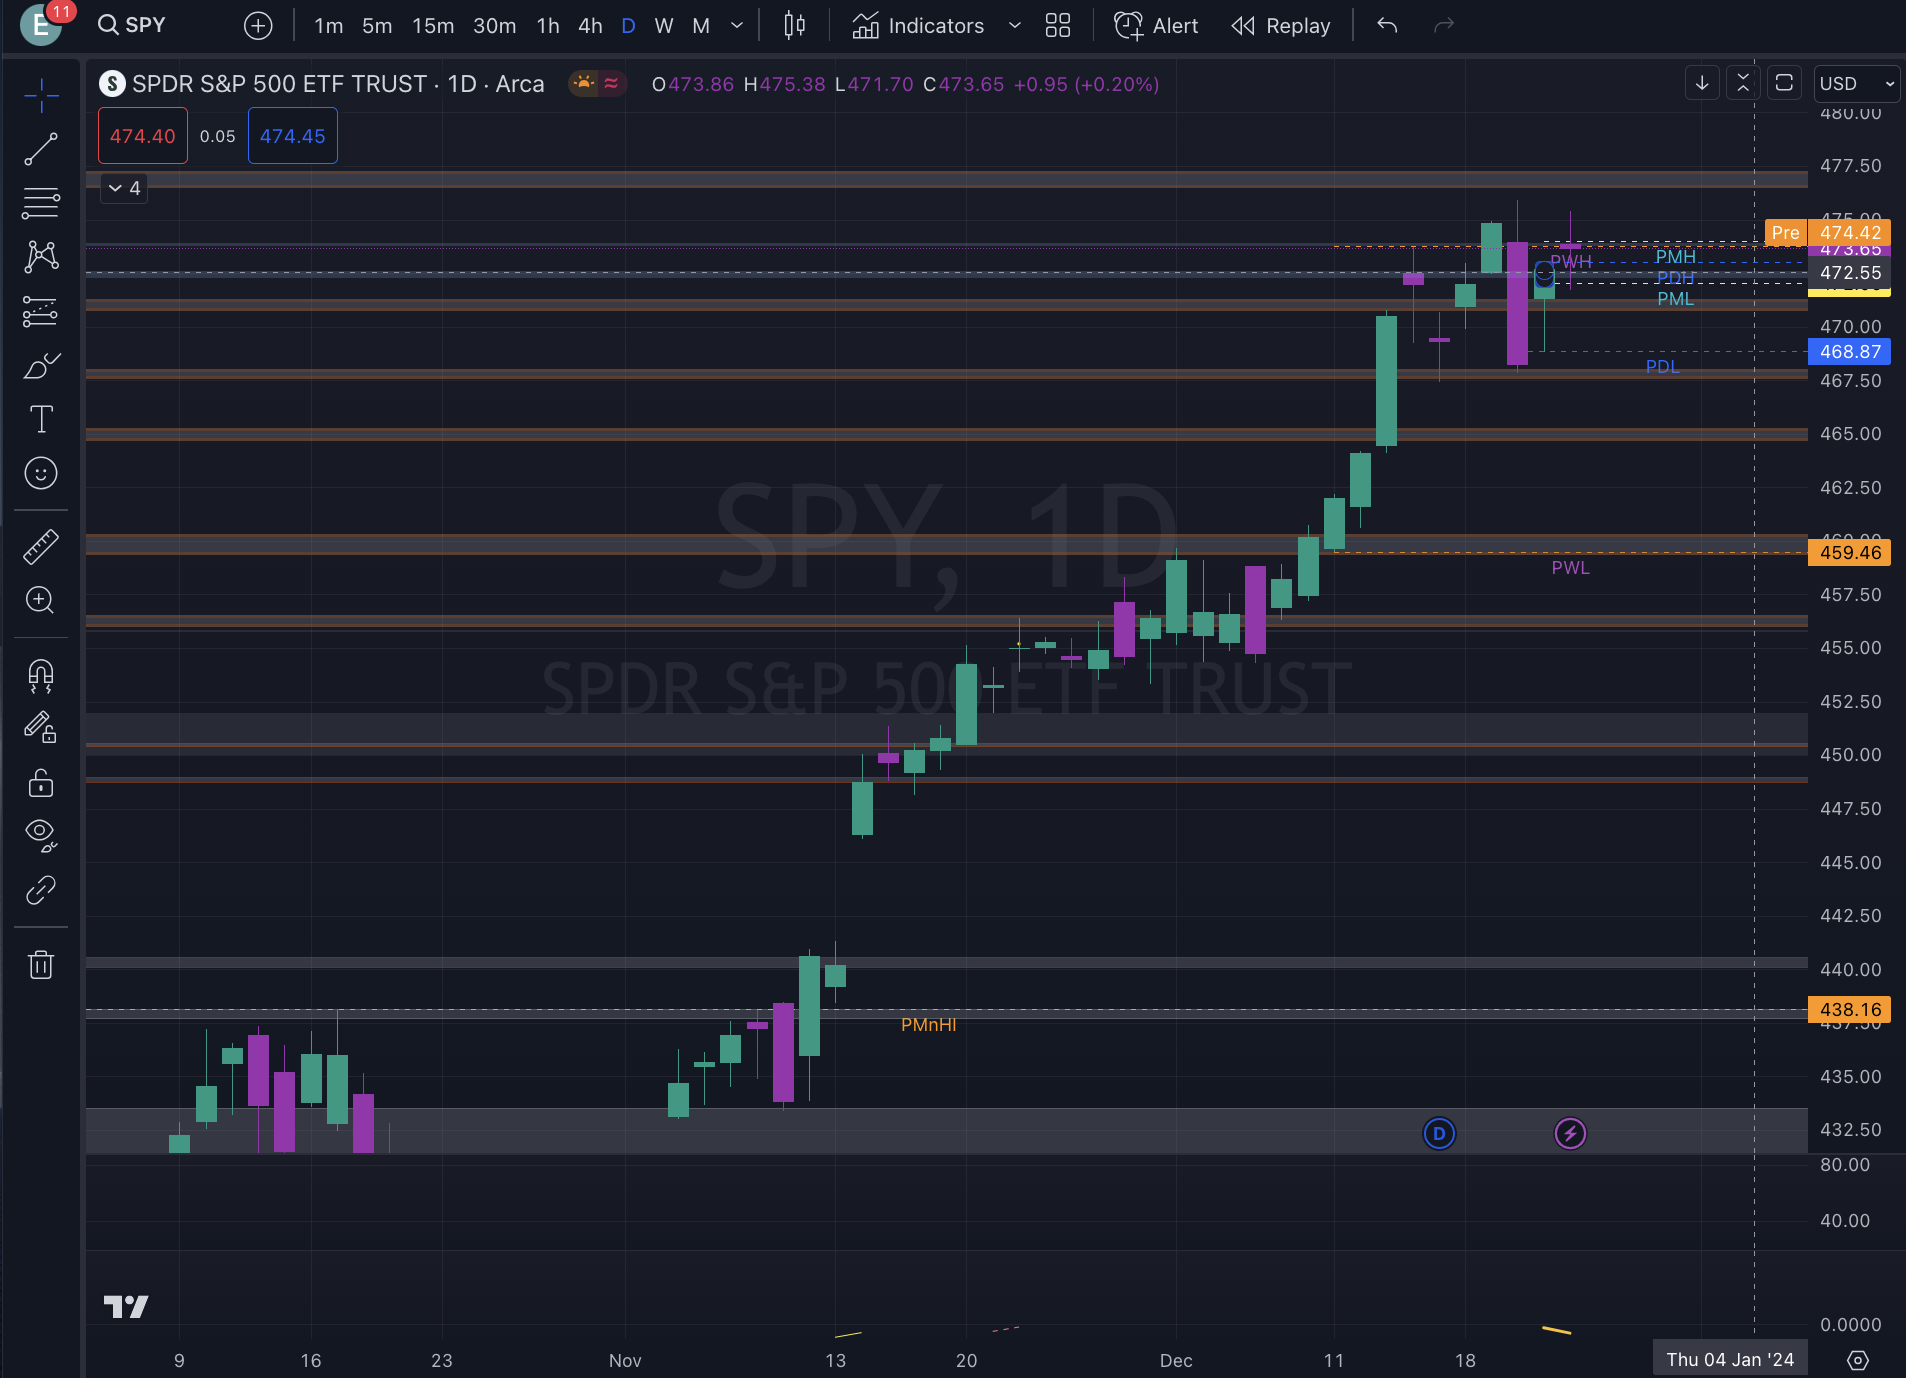
As a result of consistent changes in the market, the amount of times you’ll reset your chart drawings depends on the type of trader you are. For example, if you are a scalper, chances are you will likely reset your levels every day or every other day, because intraday levels are the weaker in terms of structures and as a result, new levels and new structures are being formed constantly.

If you are an intra-day or short-term swing trader like I am, then my rule of thumb is weekly resets. And lastly, if you are a long-term trader, then levels don’t change as frequently on a weekly or monthly timeframe and therefore, unless a major world event that no one accounted for occurs like a pandemic, then chances are you’ll check your charts once a month give or take just to make sure that the moves you’re anticipating are still on par with the levels you’ve drawn out to stay on top of reaching your profit targets or enter into an anticipated trade.
Note understanding how often you should reset your charts is important however, also understanding from what point to start is equally as important.
When it comes to technical (chart) analysis, the standard that is preached throughout the industry, which I also abide by, is to do a top-down analysis. What that means is starting your analysis of the chart movements from the highest timeframe possible to get a full picture of the direction of the market. The reason for starting at the highest timeframe is because you are then able to see more defined areas of structure easier than if you were to only focus on the time frames you trade. Also, it stands true that the zones where structure is formed are stronger on the bigger time frame because those are the areas where institutional traders have driven price to or from historically; and because we know they move the market with billions of dollars, the volume of capital they trade with is what creates the strength in those levels.
If you found this post helpful or have any other questions, please feel free to drop a comment below and I will be sure to answer your question as much detail as I possibly can in my next post. Be sure to also subscribe to this blog to get all the updates and latest posts. If you’re just getting started with Trading and struggling with deciphering, went to enter a trade that we should click to get your hands on my free options trade entry checklist.

HEY, I’M EVIE…
Hello and welcome to my world at Lane to Leisure! I am a millennial black woman, a Haitian-American, and the passionate voice behind this blog. My journey from Miami to Thailand, from a career as an Independent claims adjuster to living my dream as an expat options trader, is a story of transformation, resilience, and pursuit of freedom.
JOIN MY MAILING LIST
Created with © systeme.io


